U.S. businesses experienced modest to moderate growth during the first quarter, according to the Federal Reserve Bank’s Beige Book, a survey of business owners about conditions in the Fed’s 12 regional districts. Multiple districts reported respondents had called out “robust construction activity” in their marketplaces, a sign that business owners are feeling confident about future economic expansion.
Ahead of the first estimate of gross domestic product (GDP) for January through March 2018, the Commerce Department reported that of GDP growth in the fourth quarter was 2.9%, up slightly from the previous estimate of 2.5%. That level of economic activity represented only a small decline from the 3.2% growth in the third quarter of 2017. For the full year of 2017, GDP growth was 2.3%, a marked improvement over the 1.5% rate during the election year of 2016.
Better-than-expected consumer spending pushed GDP higher, offsetting a steeper decline in exports than was forecast. Indications are that both consumers and businesses anticipated the tax cuts that passed at year’s end and spent or invested accordingly.
Economists are expecting a slowdown when the final estimations of GDP growth for the first quarter of 2018 are announced. Although there is the anticipation of a follow on effect from the Tax Cuts and Jobs Act, uncertainty over the economic impact of the proposed tariffs is seen as dampening business investment in the first quarter.
As the Trump Administration has made policy decisions of late that have sent mixed signals to businesses, it is more difficult to gauge how long business confidence will support the economic expansion. With 70% of the gross domestic product tied to consumer spending. It is worth examining how the U.S. homeowner and consumer are behaving after the first quarter of 2018. The data from the first quarter reveals a consumer who feels good about their job and personal wealth but is behaving more cautiously.
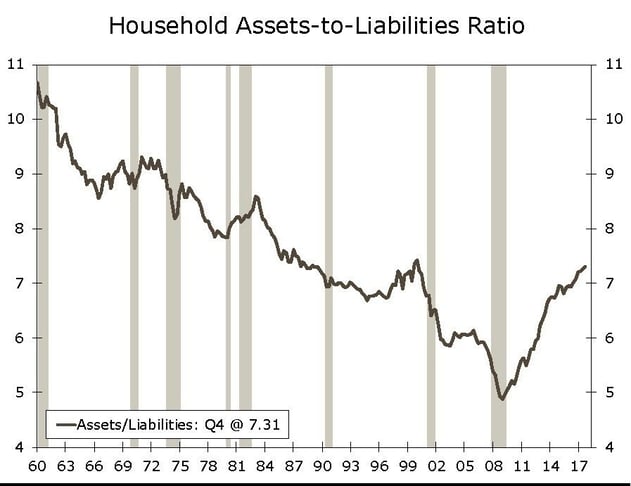
Since the financial crisis of 2008, consumers have rebuilt their finances, bringing their balance sheets into line with the pre-crisis era. Private asset-to-liability ratios have fully rebounded, hitting 7.3:1 at the end of 2017. That is the highest asset-to-liability ratio since before the 2000-2001 recession. But the long-term trend is for a higher ratio of household liabilities to assets for U.S. consumers. The asset-to-liability ratio fell from above 10.5:1 in 1960 to the 7.5:1 level of 1999. There is evidence in recent months that consumers have become more cautious as this ratio has rebounded.
Revolving credit, which is primarily credit card debt, increased by $100 million in February, following a tepid $1.4 billion increase in January. This two-month increase represents the weakest expansion of revolving credit in consecutive months since the end of 2013.

This weakening credit trend is consistent with the recent trend in consumer and retail spending, which has been slowing. Consumer confidence, as expressed in recent months’ surveys by Thompson/Reuters and the University of Michigan, remains at all-time highs, but concerns about rising prices, higher interest rates, and falling stock prices may be influencing consumer behavior more than consumers are letting on. Credit card interest rates have reached 14% annualized, a hike of 200 basis points since mid-2015. Consumer behavior has remained remarkably positive and consistent during the long recovery from the Great Recession. Changes in consumer spending and credit trends will mark a change in the direction of the overall economy, at least while the consumer adjusts to shifts in the factors affecting their income.
Other consumer metrics are consistent with behavior that often occurs late in the business cycle, although it is rarely a reliable predictor of recessions. The consumer balance sheet remains very strong, with debt service ratios as favorable as any time since the 1970s. From a high of nearly 13.5% in 2008, consumer debt is less than 10.5% of income currently. That ratio is creeping higher, a trend that is consistent with the slowing credit growth and the falling savings rate. The gap between homeowner equity and mortgage liabilities has grown to more than 4% positive, roughly double the two-point gap that has been the non-recession norm since 1990. Only the declining savings rate, which has plunged from 6% to 2% since 2016, is a concern for the consumer balance sheet. Even this factor could be deceptive, given that the massive deleveraging that followed the financial crisis precipitated six years of higher-than-normal savings to pay down debt.
Observers of consumer behavior and finances make the point that while the trends of consumer behavior seem to track the business cycle closely, the inflection point of these types of consumer metrics trends follow major economic events, rather than predict them. For example, the savings rate fell steadily from eight percent to two percent during the 15 years from 1990 to 2008. While a declining savings rate might then seem to be an indicator of economic weakness, the data shows that significant changes in savings occurred after major economic events. The trend has remained in place even in the face of a downturn, such as was the case of the savings rate during the dot.com bubble.
The best way to use consumer behavior to predict the economic outcome seems to be monitoring spending. History has shown that consumer confidence and the consumer’s sense of individual wealth can be false flags. In the final analysis, if consumers aren’t spending, stores aren’t selling and manufacturers soon won’t be manufacturing. It appears that credit metrics follow these straightforward realities.
One measure of consumer spending that has been less reliable as a bellwether is housing starts. Investment in a new home isn’t the same as spending on consumable items, but home sales and housing starts reliably indicated the consumer’s frame of mind prior to the housing crisis. In simplest terms, increases in housing starts occurred when economic expansion was getting underway.
The housing bubble of the mid-2000s created an imbalance that still exists. Sufficient time has passed to have absorbed the overhanging inventory that plagued the housing industry early in this decade; however, the lingering after effects continue to impact the market. Regulatory and lending changes have dampened the appetite for residential development, keeping lot inventory lower than the levels of demand. A psychological side effect of the housing crisis has also limited the market, keeping a younger generation of potential home buyers out of the market for longer than its predecessors. The supply/demand imbalance has accelerated the price of homes nationwide, raising the barriers of entry to younger buyers who are already wary of home ownership.
These effects can be seen in the latest housing start data. This is especially true in the multi-family market, which was seen to be slightly overbuilt. March’s data on starts showed a year-over-year increase of 9.5% for multi-family projects begun during the first three months of 2018. This unexpected level of increase may be a reflection of the slower transition of 25-to-35-year olds from renting to owning and the resilience of New Urbanism, which explains the growing strength of the condominium market.
Overall, housing starts increased 8% in January-to-March 2018 compared to the same months in 2017. March’s total starts hit the 1.319 million mark, a post-crisis high. Single-family home starts jumped 7% during the same period. That level of activity suggests that the pace of lot development is increasing, although a comparison of the activity levels during the busy second quarter will be a better reading of the trends. Comparison of building permits, year-to-year, suggests that the trends will continue. Permits were 6.2% higher during the first quarter of 2018, with single-family permits up 5.3% while multi-family permits rose seven percent.
The continued solid residential construction activity is one of the reasons that total construction spending in the U.S. remains on an upward trend that has been virtually unabated since February 2011. The latest data on construction spending showed an annual pace $1.273 trillion, an all-time record high. Spending has been above the March 2006 $1.213 trillion peak of the previous business cycle for 13 consecutive months.

Tight construction labor supply may constrain the spending growth rate in the busy second quarter but rising material prices will likely assure that construction spending will maintain the steady 3% long-term trend into the foreseeable future.

This article originally appeared in BreakingGround Magazine May/June 2018.