Construction spending in August, the most recent month reported by the Census Bureau, bumped slightly higher than the revised July total. Spending on construction in the U.S. was $1.317 trillion in August, an increase of $1 billion over July and a 6.5% increase compared to August 2017. Within the August spending report, there was unusual stability in the activity of the major sub-categories of construction, an indication that the economy is a rising tide that is lifting all boats.
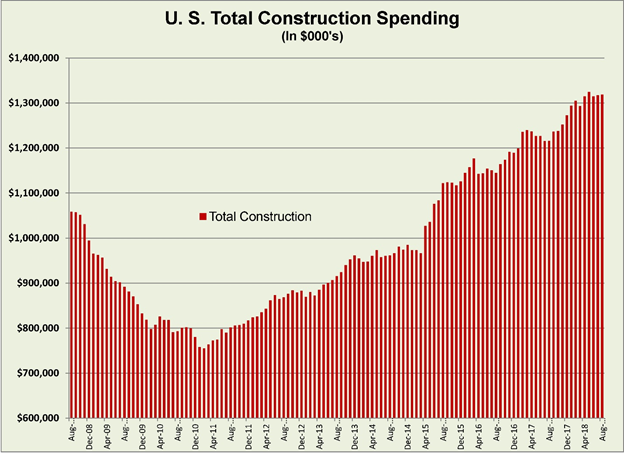
Compared to one year earlier, public construction spending stood out as an outlier, jumping 14% year-over-year. Construction volume was 4.4% higher for private spending, 4.0% higher for residential investment, and 4.8% higher for private non-residential spending. No major sub-category saw a year-over-year decrease. The only cautionary note is that the Census Bureau data is seasonally adjusted but not adjusted for inflation. In light of the significant spike in material prices that began in May 2018, the increase in volume may be attributable as much to inflation as growth in demand.
As a reflection of economic demand, however, the increase in construction activity in 2018 seems to fairly mirror the growth in economic activity, consumer and business confidence. That confidence is borne out by increases in business investment and consumer spending. And the underlying strength of the economy, as always, is in the labor market.
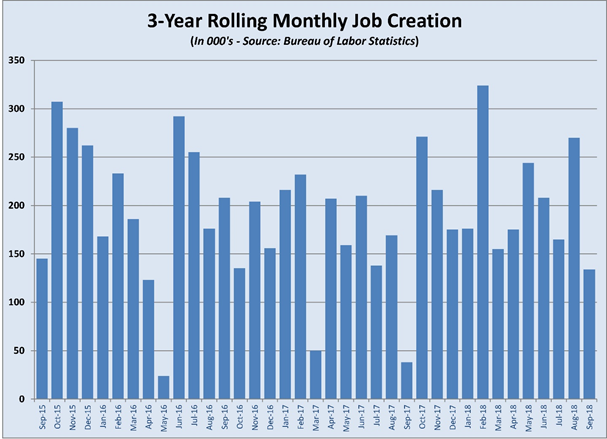
September’s jobs report had a disappointing headline but the data represented an extremely strong economy and labor market. Hidden in the October 5 report from the Bureau of Labor Statistics were significant upward revisions in the hiring numbers for July and August. The latter, which jumped from 201,000 to 270,000 new jobs, may well have been the reason that September’s hiring was lower than the 180,000 new jobs that economists expected. Despite the lower number of new hires in September, U.S. employers have added an average of 209,000 workers per month during the past 12 months.
Looking below the headline employment gain in September, there was a decline in the unemployment rate to 3.7%. Sectors with the largest gains were business and professional services (54,000) and healthcare (26,000). Transportation and warehousing (24,000) and construction (23,000) were the other sectors that saw gains of more than 20,000 workers. Construction is one of the strongest sectors in year-over-year gains, adding 315,000 jobs in the past 12 months. Manufacturing, long a drag on employment, is also in the midst of an upward trend, adding 278,000 jobs since September 2017.
The total number of unemployed persons fell to 6.0 million, a decline of 795,000 from September 2017. There was little change in the number of marginally-attached workers and those workers categorized as discouraged, meaning that they were not looking for work because of a lack of opportunities. This suggests that there is no remaining slack in the labor force. If true, that assumption could explain the lower hiring in September. It could also signal that employment gains closer to the 100,000 mark will become the norm going forward. While slower employment growth will not reflect the strength of the economy at first, the full employment status will begin to be a drag on growth, as companies will be unable to add capacity without adding workers. If this becomes the trend, low unemployment will become a drag on gross domestic product growth by the latter half of 2019.
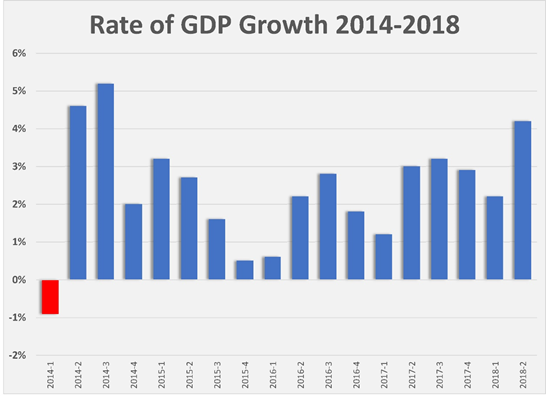
The Federal Reserve Bank appears to be considering that limitation in its forecast for 2019 GDP growth, which it pegs at 2.0%. That’s a decline from what the Fed expects will be a 2.8% jump in GDP in 2018. The final estimate of GDP growth for the second quarter by the Bureau of Economic Analysis (BEA) – unchanged from the second estimate at 4.2% – seems to make the Fed’s 2018 forecast likely. The September 27 report from the BEA also verified that GDP growth in quarter one was 2.2%. GDP growth was driven higher in the second quarter by higher inflation and a jump in exports that was timed to beat tariffs. The same report found corporate profits had jumped by $65 billion in the second quarter (compared to $26.7 billion in the first), with profits of non-financial domestic corporations leaping $53 billion, an increase of 64% compared to the first quarter. Further evidence of strength of the economy came from the BEA’s October 26th first estimate of third quarter GDP, which came in higher than expected at 3.5%.
It’s clear from the Fed’s Open Markets Committee (FOMC) minutes that concerns about an overheating economy are greater than worries that higher interest rates will slow down growth. In raising rates 25 basis points in late September – the eighth such rate hike since December 2015 – FOMC members saw the extremely tight labor market, strong consumer confidence and spending, and modest inflation as signals that the economy was more than strong enough to withstand higher interest rates. Barring some thoroughly unexpected economic shock, a fourth 25 point hike is expected in December, with at least two more hikes contemplated in 2019.
While the higher interest rates have thus far done little to dampen borrowing, the increases have heightened the risk to the economy from tighter fiscal policy. For those who weigh the relationship between long- and short-term interest rates as an economic signal, the Fed’s actions bring the yield curve dangerously flat. Further hikes in 2019 could lead to an inverted yield curve – one where short-term rates are higher than long-term rates – and that will elevate fears of a slowdown to follow. An inverted yield curve is far from a foolproof indicator, however, and the U.S. economy appears to be rolling higher in spite of tighter fiscal policy.
Treasury markets may have been responding to this imbalance when the 10-year bond yield jumped 25 basis points in late September/early October. The bond market was likely reacting to the bevy of strong economic data from September and buying into the Fed’s fiscal guidance. At 3.25%, where the rally peaked, the cost of borrowing should not discourage investors or developers from commercial real estate. Notwithstanding the stock market selloff that coincided with the run up in Treasury yields, interest rates below 4% should not drain investors from stocks either. The jump in rates did push 30-year mortgage rates above 5% for the first time since 2010. That’s a psychological barrier that could dampen home buying, even though the real cost impact is minor. Of greater concern is the long-term interest trend, which has moved about 1% during each rally since the Fed began tightening rates. At 6% for 30-year debt, mortgages will become unaffordable for some buyers.
There are some early indications that the housing market is slowing, whether due to the prospect of higher borrowing cost or not. The National Association of Realtors’ October 19 report on existing home sales showed a decline for the fifth straight month in September. The slowdown to an annual rate of 5.1 million homes was the lowest rate in three years; and it was enough of a decline to boost inventories of homes for sale by 1.1%. The October 17 report on housing starts showed a 5.3% decline from August to September, which eroded the year-over-year increase to 3.7%. Construction gains were roughly equal for both single-family units (up 4.8%) and multi-family units (up 4.2%). Permits approved in September were up 4.1%. Year-to-date data for new home construction is consistent with a market that is growing at a slower rate than in the past few years.
Recent Trump Administration actions both moderated and exaggerated another area of risk to the current economic cycle, U.S. trade policy.
The 10% tariff placed on an additional $200 billion of Chinese goods on September 24 triggered another round of corresponding tariffs on U.S. goods going to China. The tariffs, along with the administration’s tough rhetoric and unproductive negotiations, have begun to have a negative impact on U.S. businesses. According to JLL’s chief economist, Ryan Severino, “trade tensions will likely drag on GDP growth by roughly 50 basis points over the next 12-15 months.” Of growing concern to U.S. companies with operations in China is the potential for the Chinese government to take punitive action against individual corporations, as occurred in the early years of U.S. investment there. The Xi administration has shown more willingness to take stronger actions to protect Chinese interests and strategically damage U.S. interests than its predecessor.
Closer to home, the completion of an agreement between the U.S., Mexico and Canada to replace NAFTA brings a sigh of relief to U.S. businesses, particularly manufacturers. Had NAFTA simply disintegrated there would have been significant damage done to the supply chain for U.S. manufacturing. Beyond the negative impact on U.S. manufacturing, a disrupted supply chain would have roiled the markets for major consumer products and durable goods like automobiles. The United States-Mexico-Canada Agreement prevented another trade disagreement from dragging the economy.
Electoral politics is perhaps the one potential shock that could pause the economy going into 2019, but even a strong agenda by a Democratic Congressional majority is unlikely to include policies that could damage the economy. There could be some dimming of business confidence, given the strong pro-business policies of the Trump Administration, but it’s more likely that a Democratic agenda would include infrastructure investment that would drive construction activity higher still in the next year. Reprinted with permission from BreakingGround Magazine