As the seventh year of economic expansion begins in the U.S., expectations for gross domestic product (GDP) in 2016 are in line with a mature economic cycle. In a growth environment of just under three percent, however, economists forecast continued strength in hiring and for construction spending to increase at a rate that is three times the rate of GDP growth in 2016.
Observers whose forecasts reflect a weak outlook for the global economy are predicting GDP growth of 2.4 or 2.5 percent for the U.S. economy in 2016. Most economists see the strong employment market, more rapidly rising personal incomes and low costs of credit – even with the first interest rate increases – as factors that will encourage consumer and business spending in 2016. That school of thinking is driving the majority of forecasts to look for GDP growth of 2.7 or 2.8 percent in the U.S. And most forecasters continue to be fooled by the strength of job creation as the recovery grows long in tooth.
New hiring in October and November exceeded the expectations of virtually all economists, especially on the heels of slowing job creation in August and September. Bureau of Labor Statistics (BLS) reported on December 4 that hiring increased in November by 211,000 jobs. That report came on the heels of 298,000 new jobs in October. In addition to the higher-than-expected November number, BLS revised both October and September – which was weaker – upwards by 35,000 jobs. The improved hiring pace lifted the monthly average to 210,000 new jobs per month for the full year of 2015, a pace that is again higher than forecasted.
The strength of the job market helps to explain why construction spending is significantly higher. At a November 19 seminar held at GreenBuild in Washington, DC, economists for the Associated General Contractors (AGC) and American Institute of Architects (AIA) gave their forecasts for 2016 and 2017.
Kenneth Simonson, chief economist for the AGC, noted that construction in 2015 was significantly stronger than expected. Through that date, construction spending was up 14.1 percent year-over-year, with residential construction still very strong well into a period of recovery. Although the multi-family sector was up 27 percent and single-family was up 13 percent year-over-year, Simonson saw that trend peaking in 2015 with both segments of residential construction slowing to between five and ten percent in 2016. Simonson’s forecast for 2016-2017 is for six to ten percent increases in nonresidential construction. He sees office construction as the strongest building type, with growth in construction of educational and healthcare facilities at or above five percent. Notable among the weaker sectors will be hotels and manufacturing, which Simonson predicts could decline by as much as ten percent.
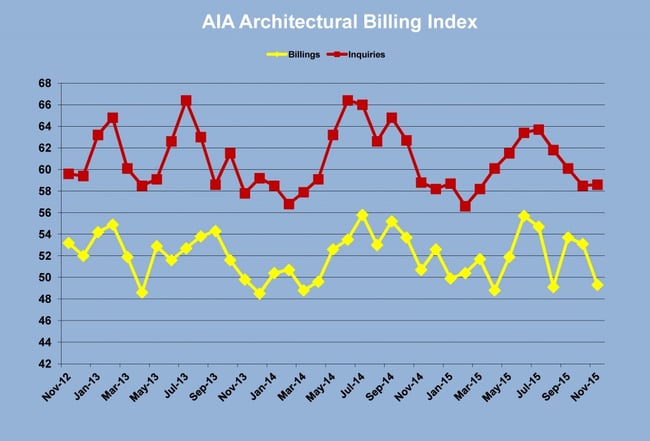
AIA’s Kermit Baker estimated that total nonresidential construction would end the year 2015 up 8.9 percent and forecasts that nonresidential construction would see similar growth, rising 8.2 percent, in 2016. Baker, the AIA’s chief economist and senior research fellow at the Joint Center for Housing Studies of Harvard University, explained that the prevailing trend in the AIA’s Architectural Billing Index (ABI) was positive. The ABI has been above 50 – meaning more firms experienced increased billing – most of 2015, including three of the past four months. Moreover, Baker noted that architectural backlogs have climbed from 4.2 months in 2011 to 5.6 months in 2015. Both of these signals indicate that construction activity should be strong through at least summer of 2016.
One business cohort that appears to agree with the predictions of Simonson and Baker is the so-called Middle Market. The National Center for the Middle Market (NCMM) is a research effort in collaboration with Ohio State University and GE Capital that surveys the behavior and attitude of businesses that have between $10 million and $1 billion in annual revenues. These companies comprise only three percent of the total number of businesses but employ one-third of all U.S. workers and comprise nearly one-third of U.S. GDP. As of the third quarter of 2015, the businesses in the Middle Market were experiencing steady growth at a faster pace than the U. S. overall but were feeling more cautious.
According to the NCMM’s Middle Market Indicator, growth of Middle Market companies has been 7.2 percent over the past 12 months, which has spurred employment growth of 4.1 percent. As these companies look forward, however, their forecasts are for growth to slow to 4.1 percent over the next year, with employment gains slowing to 3.2 percent. Only 49 percent expect revenues to rise in the coming year, compared to 64 percent who felt revenues would rise in fall of 2014. Slightly more than one in three expects to add jobs in the next 12 months, although those planning to invest capital were still at 61 percent, down only two points from last year.
It appears that most of caution comes from the slow overseas markets. When surveyed, the Middle Market companies showed 81 percent confidence in their local markets and 72 percent confidence in the U.S. market, but only 49 percent expressed confidence in the global markets.
Conditions in the Eurozone have strengthened, with third quarter real GDP growth at 1.7 percent. That’s the best year-over-year growth since 2011; however, the real GDP growth rate for European Union nations is still weak by historical standards and is well below the pre-recession peak in 2008. With fewer headwinds and internal crises, the Eurozone is not the drag on the global economy it represented just 12 months ago. The main threat to the U.S. economy that Europe poses is the distinct possibility that the European Central Bank will ease monetary policy further to boost growth above anemic rates, a move that will strengthen the dollar and make exporting tougher for U.S. manufacturers.
For 2016, the drag on the global economy will come from the so-called BRIC countries – Brazil, Russia, India and China – that fueled the global boom in the mid-2000s.
Brazil’s political paralysis and poor infrastructure are outweighing its economic potential. Low oil prices are hurting Brazil and making life even more difficult for Russia, which is also struggling with Western sanctions. China’s slowing growth rate looks to decline further in 2016 and the threat of major asset bubbles remains. Only India among the BRIC nations can boast continued strong economic growth, but its relative size and more limited trade ties mean India’s economy won’t offset the slowing Chinese growth.
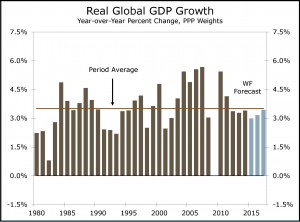
Industrialization of previously underdeveloped economies has slowed, meaning that global economic growth is more likely to hover near the long-term historical average of three percent during the next few years.
The biggest negative impact on the U.S. from sluggish global economic growth continues to be on manufacturing. November’s ISM manufacturing report showed that activity fell below the breakeven point for the first time in several years. Manufacturing activity rose only 1.7 percent and the ISM survey dipped to 49.6. As in recent months, declining activity was due to continued inventory depletion and weak exporting. The latter is a result of both weaker global demand and the relative strength of the U.S. dollar.
U.S. manufacturing is also hurt by the slowdown in oil and gas exploration triggered by the 50 percent price decline in summer 2014. Lower energy costs are having a salutary effect on the consumer and on energy-dependent manufacturing, however, and the International Energy Agency (IEA) is forecasting that demand for energy will climb in 2016. The IEA predicts that markets should be more stable for energy pricing – not necessarily great news for producers. Its outlook for oil pricing is for $60/barrel conditions in the next couple years, with gradual price increases to the $80/barrel level in 2020. The IEA also makes a persuasive argument for prices to remain at $50/barrel into the 2020s.
Assuming that the five-year outlook for oil doesn’t shift dramatically – never a good assumption – the forecast should mean that the U.S. economy can rely on having cheaper energy but lower contributions to GDP growth from the energy sector.
For a change there was good news from Washington, where Congress and the President were able to come to an agreement on the budget and debt ceiling this past month that will allow defense and discretionary spending to rise modestly in 2016 and also push any fight over the debt ceiling past the election into 2017. With the budget deal in place, government spending is poised to rise at its strongest pace in seven years in 2016 and will likely boost real GDP growth by 0.3 percentage points.
Congress also passed the first comprehensive transportation bill since 2005. The Fixing America’s Surface Transportation (FAST) Act of 2015 was signed into law on December 4, providing $305 billion over the next five years. The final bill fell short of the $400 billion that administration officials felt would be needed to avoid falling behind traffic growth but the law provides states with assurance about the federal contribution towards infrastructure repairs.
Data on construction spending at the end of 2015 supports the optimism that economists like Ken Simonson and Kermit Baker expressed about 2016. The Census Bureau’s report on October construction spending showed total activity at a record $1.107 trillion, the fifth consecutive month above $1 trillion. Private spending topped $800 billion, an increase of 15.9 percent year-over-year, with the investment split evenly between residential and nonresidential construction.
The Census Bureau reported on December 16 that housing starts in November were at a seasonally adjusted annual rate of 1,173,000. That is 10.5 percent higher than October and 16.5 percent higher than November 2014. Building permits for November were at a seasonally adjusted annual rate of 1,289,000, an 11 percent increase over October and 19.5 percent more than November 2014.
U.S. economic activity should support high single-digit construction growth in 2016. Unlike the last growth cycle, credit has not been overextended as the expansion matured. There remain fewer financing obstacles, which may encourage more investment as owners see the beginning of a rate increase cycle as a good time to borrow. Moreover, investment interest in the U.S. is likely to increase further in 2016, as emerging market economies are perceived as too risky and mature economies are viewed as too sluggish.